Give the gift of life-changing education! Donate Now!
A distribution is best thought of as a table. Thus a frequency distribution can be thought of as a frequency table, i.e. a list of discrete values and their frequencies.
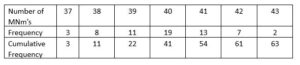
Example: The number of M&Ms is counted in several bags, and recorded in the frequency distribution/table below :
![]()
Cumulative frequency
Add up the frequencies as you go down/along the list.
2.1.1 Stem and leaf & back-to-back stem and leaf diagrams
Line up the digits as leaves on the branches so that it looks like a bar chart. The leaves on each branch must be in numerical order, starting from the stem. Add a key; e.g. 5|2 means 52, or 4|3 means 4⋅3 etc. Comparing two distributions from a back to back stem and leaf diagram. Comparing two distributions from a back to back stem and leaf diagram.
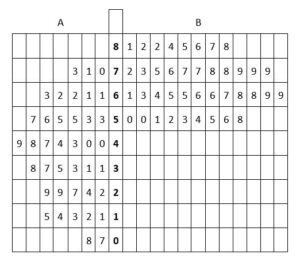
Comparison: 1. The values in A are on average smaller than those in B 2. The values in A are more spread out than those in B. By looking at the diagram you should always be able to make at least two comparisons, usually one concerning the median and another concerning the spread, often the inter-quartile range.
2.1.2 Grouped frequency distributions
Class boundaries and widths When deciding class boundaries you must not leave a gap between one class and another, whether dealing with continuous or discrete distributions.
For discrete distributions avoid leaving gaps between classes by using class boundaries as
shown below: X = 0, 1, 2, 3, 4, 5, 6, 7, … discrete.
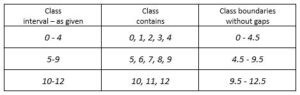
For continuous distributions the class boundaries can be anywhere.
Example: 0 ≤ x < 5, 5 ≤ x < 9, 9 ≤ x < 16, etc.
Note that each interval starts at the point where the previous interval ended, but 5, for example, goes in the second interval 5 ≤ x < 9.
Cumulative frequency curves for grouped data For a discrete frequency distribution/table.
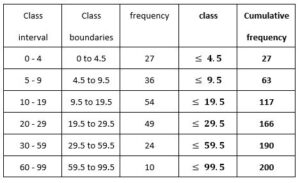
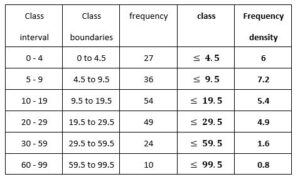
Plot points at ends of intervals, (4.5, 27), (9.5, 63), (19.5, 117) etc. and join points with a smooth curve.
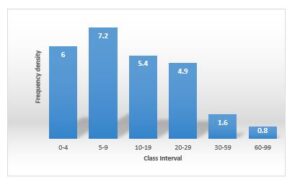
2.1.3 Histograms
Histograms deal with continuous data. NO SPACES BETWEEN THE BARS. Therefore when we have class intervals of
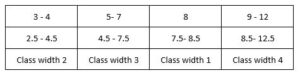
To draw a histogram, first draw up a table showing the class intervals, class boundaries, class widths, frequencies and then height of each bar is
calculated as \(\frac{frequency}{class width}\) as shown below .
(the height is called the frequency density)