Give the gift of life-changing education! Donate Now!
Mode: The mode is the value, or class interval, which occurs most often
Mean
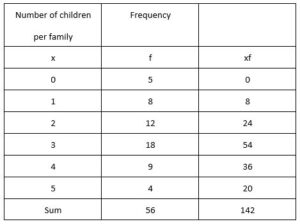
The mean of the values with frequencies the x1 , x2…… xn with frequencies f1 ,f2,… ,fn the mean is m = x =\(\frac{1}{N} \) \(\sum_{i = 1}^n \) xi , fi=1 where N= \(\sum_{i = 1}^n \) fi

\(\sum{x_i f_i}\) = 142 and N = \(\sum{f_i}\) = 56
=> \(\bar{x}\) = \(\frac{142}{56}\) = 2.54
Coding
The weights of a group of people are given as x1 ,x2………. xn in , kilograms. These weights are now changed to grammes and given as t1 , t2……. tn In this case– this is an example of coding.
Coding and calculating the mean
With the coding, ti = \(\frac{x_{i-20 }{5}\), we are subtracting 20 from each x-value and then dividing the result by 5.We first find the mean for , and then we reverse the process to find the mean for ⇒ we find the mean for , multiply by 5 and add 20, giving
x ̅=5t ̅+20
Median: The median is the middle number in an ordered list.
When to use mode, median and mean
Mode
You should use the mode if the data is qualitative (colour etc.) or if quantitative (numbers) with a clearly defined mode (or bi-modal). It is not much use if the distribution is fairly even.
Median
You should use this for quantitative data (numbers), when the data is skewed, i.e. when the median, mean and mode are probably not equal, and when there might be extreme values
(outliers).
Mean
This is for quantitative data (numbers), and uses all pieces of data. It gives a true measure, and should only be used if the data is fairly symmetrical (not skewed), i.e. the mean could not be affected by extreme values (outliers).
Median (Q2), quartiles (Q1, Q3) and percentiles
Discrete lists and discrete frequency tables
To find medians and quartiles
Interquartile range
The interquartile range, I.Q.R., is Q3 – Q1.
Range
The range is the largest number minus the smallest (including outliers).
Discrete lists
A discrete list of 10 numbers is shown below:
x 11 13 17 25 33 34 42 49 51 52
n = 10 for Q1, \(\frac{n}{4}\) = 2.5 so use 3rd number, ⇒ Q1 = 17
for Q2, 2 = 5 so use mean of 5th and 6th, ⇒ Q2 = 33 median
for Q3 , 34 = 7.5 so use 8th number, ⇒ Q3 = 49
The interquartile range, I.Q.R., is , and the range is
Grouped frequency tables, continuous and discrete data
To find medians and quartiles
Box Plots In a group of people the youngest is 21 and the oldest is 52. The quartiles are 32 and 45, and the median age is 41. We can illustrate this information with a box plot as below – remember to include a scale and label the axis.

Outliers
An outlier is an extreme value. You are not required to remember how to find an outlier – you will always be given a rule.
For example : Outliers are values outside the range
Q1 – 1⋅5 × (Q3 – Q1) to Q3 + 1⋅5 × (Q3 – Q1).
Skewness
A distribution which is symmetrical is not skewed
Positive skew
If a symmetrical box plot is stretched in the direction of the positive x-axis, then the resulting distribution has positive skew.
For positive skew : Q3 – Q2 > Q2 – Q1
The same ideas apply for a continuous distribution, and a little bit of thought should show that for positive skew mean > median > mode.
Negative skew If a symmetrical box plot is stretched in the direction of the negative x-axis, then the resulting distribution has negative skew.
For negative : Q3 – Q2 < Q2 – Q1
The same ideas apply for a continuous distribution, and a little bit of thought should show that for negative skew mean < median < mode.