Give the gift of life-changing education! Donate Now!
16.1- Introduction
• Construct and interpret bar charts, pie charts, pictograms, simple frequency distributions, frequency polygons, histograms with equal
and unequal intervals and scatter diagrams
• construct and use cumulative frequency diagrams
• estimate and interpret the median, percentiles, quartiles and
interquartile range for cumulative frequency diagrams
• calculate with frequency density
• understand what is meant by positive, negative and zero
correlation with reference to a scatter diagram
• draw a straight line of best fit by eye.
For unequal intervals on histograms, areas are proportional to frequencies and the vertical axis is labelled ‘Frequency density’.
16.2- Averages and Spread
There are three main types of average :
mean – The mean is what most people mean when they say ‘average’. It is found by adding up all of the numbers you have to find the mean, and dividing by the number of numbers. So the mean of 3, 5, 7, 3 and 5 is \(\frac{23}{5}\) =4.6.
mode – The mode is the number in a set of numbers which occurs the most. So the modal value of 5, 6, 3, 4, 5, 2, 5 and 3 is 5, because there are more 5’s than any other number.
median – The median of a group of numbers is the number in the middle, when the numbers are in order of magnitude. For example, if the set of numbers is 4, 1, 6, 2, 6, 7, 8, the median is 6
16.3- Box Plots and Cumulative Frequency Graphs
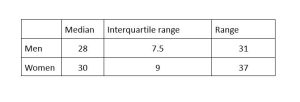
Question 1 : 100 men and 100 women took a test. The scores are represented in the table below. Draw a box plot?
16.4- Time Series
IA time series is a series of data points indexed (or listed or graphed) in time order. Most commonly, a time series is a sequence taken at successive equally spaced points in time. Thus it is a sequence of discrete-time data. Examples of time series are heights of ocean tides, counts of sunspots, and the daily closing value of the Dow Jones Industrial Average.
There are 3 types of graph:
1. Random / Erratic.
2. Repeated cyclic
3. Ones with particular trend/direction
‘Seasonality’ & Cyclic time series
Seasonality is the term for data that has a periodicity of one year. That is, it alters over a period of one year, then repeats to some degree. The highs and lows may alter, but the general shape of the graph is similar year on year.
Similarly a Cyclic time series repeats itself. However, this is a more general term. The period may be seconds(like the beat of a heart) or thousands of years(like the coming and going of ice ages).
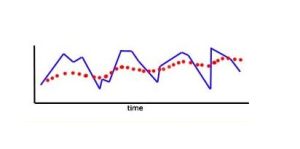
Trends – the ‘Moving Average’
A trend is a simplification of chaotic time-related data to show the underlying movement of values.
A Moving Average is simply the average of consecutive blocks of data. In this way, fluctuations in a curve are ‘ironed out’.
The number of pieces of data in a block is termed the number of ‘points’.
3 pieces of data in a block is a ‘3 point’ moving average
10 pieces of data in a block is a ’10 point’ moving average ….etc.
16.4- Summary and Review
A time series graph is a line graph of repeated measurements taken over regular time intervals.Time is always shown on the horizontal axis.
On time series graphs data points are drawn at regular intervals and the points joined, usually with straight lines. Time series graphs help to show trends or patterns.
16.5- Assessment 16
Question 1 : The range of a set of numbers is \(15\frac{1}{4}\). The smallest number is \(-2\frac{7}{8}\). Calculate the largest number?